Introduction to Quantum Computing
Qiskit Visualization
Counts and State Visualizations
The counts and state visualizations include:
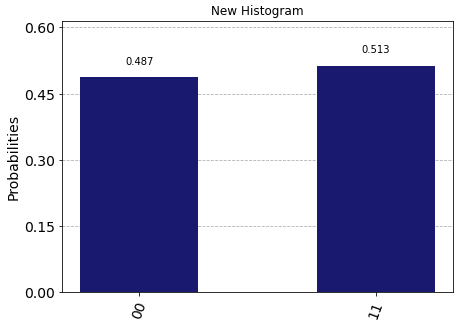
- plot_histogram: Plot a histogram of data
- plot_bloch_vector: Plot the Bloch sphere.
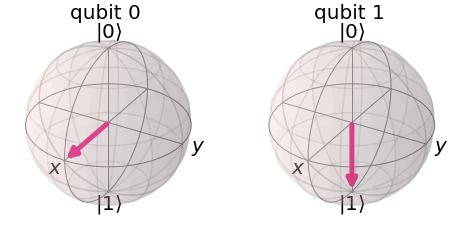
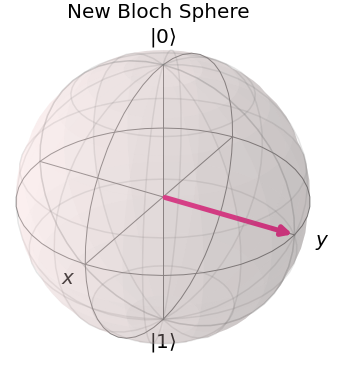
- plot_bloch_multivector: Plot the Bloch sphere
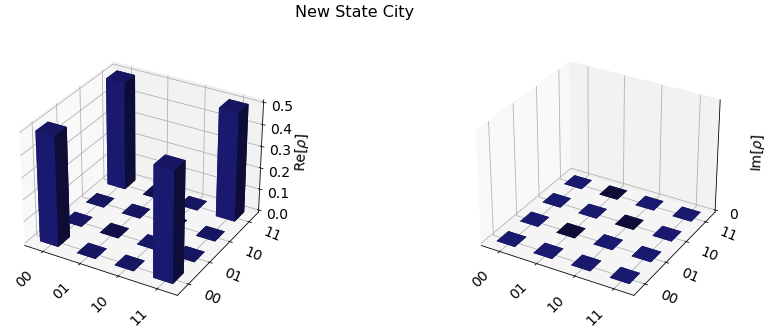
- plot_state_city: Plot the cityscape of quantum state
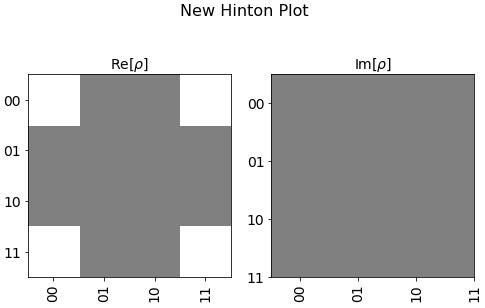
- plot_state_hinton: Plot a hinton diagram for the density matrix of a quantum state
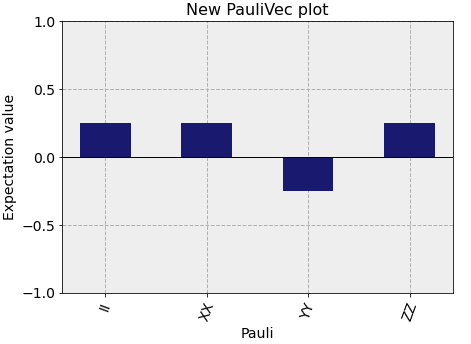
- plot_state_paulivec: Plot the paulivec representation of a quantum state
- plot_state_qsphere: Plot the qsphere representation of a quantum state
 |
 |
 |
 |
 |
 |
Device Visualizations
- plot_gate_map: Plots the gate map of a device
- plot_error_map: Plots the error map of a given backend
- plot_circuit_layout: Plot the layout of a circuit transpiled for a given target backend
- plot_coupling_map: Plots an arbitrary coupling map of qubits (embedded in a plane)
Circuit Visualizations
- circuit_drawer: Draw the quantum circuit
-
circuit_drawer(circuit, scale=None, filename=None, style=None,
output=None, interactive=False, plot_barriers=True,
reverse_bits=False, justify=None, vertical_compression='medium',
idle_wires=True, with_layout=True, fold=None, ax=None,
initial_state=False, cregbundle=True)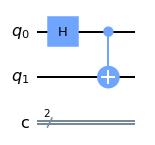
-
Array/Matrix Visualizations
- array_to_latex: Latex representation of a complex numpy array (with dimension 1 or 2)
Single Qubit State Transition Visualizations
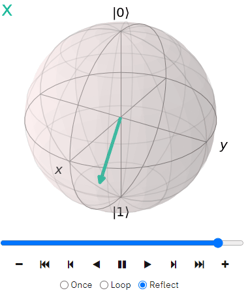
- visualize_transition: creates an animation showing the transitions between states of a single qubit by applying selected quantum gates (operators)
visualize_transition(circuit, trace=False, saveas=None, fpg=100, spg=2)
References:
- Visualizations:
https://qiskit.org/documentation/apidoc/visualization.html - Statevector.Draw:
https://qiskit.org/documentation/stubs/qiskit.quantum_info.Statevector.draw.html?highlight=draw - Visualizing a Quantum Circuit:
https://qiskit.org/documentation/tutorials/circuits_advanced/03_advanced_circuit_visualization.html - Basic Qiskit Syntax:
https://qiskit.org/textbook/ch-appendix/qiskit.html - Learn in Qiskit:
https://qiskit.org/learn/ - Qiskit:
https://qiskit.org - Qiskit Documentation:
https://qiskit.org/documentation/index.html