Introduction to Quantum Computing
Draw Method
The syntax for the QuantumCircuit Draw method is:
QuantumCircuit.draw(
output=None,
scale=None,
filename=None,
style=None,
interactive=False,
plot_barriers=True,
reverse_bits=False,
justify=None,
vertical_compression='medium',
idle_wires=True,
with_layout=True,
fold=None,
ax=None,
initial_state=False,
cregbundle=True
)
The "drawers" or output source for drawing the quantum circuit includes the choices of text, mpl (matplotlib), and latex.
filename is used to save the output of the drawers (eg. filename='qteleportation.pdf')
initial_state is used to add the initial state of the wires to the drawing (eg. initial_state=True)
fold is used to set pagination
The draw method can also be used to visualize Statevectors. Draw will return a visualization of the Statevector.
Statevector.draw(output=None, **drawer_args)[SOURCE]
repr: ASCII TextMatrix of the state’s __repr__.
text: ASCII TextMatrix that can be printed in the console.
latex: An IPython Latex object for displaying in Jupyter Notebooks.
latex_source: Raw, uncompiled ASCII source to generate array using LaTeX.
qsphere: Matplotlib figure, rendering of statevector using plot_state_qsphere().
hinton: Matplotlib figure, rendering of statevector using plot_state_hinton().
bloch: Matplotlib figure, rendering of statevector using plot_bloch_multivector().
city: Matplotlib figure, rendering of statevector using plot_state_city().
paulivec: Matplotlib figure, rendering of statevector using plot_state_paulivec().
For example, .draw('qsphere') will produce this graphic. 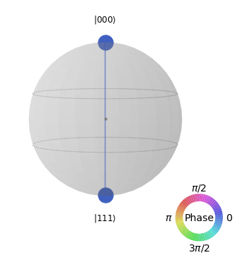
References:
- Draw Method:
https://qiskit.org/textbook/ch-appendix/linear_algebra.html - Statevector.Draw:
https://qiskit.org/documentation/stubs/qiskit.quantum_info.Statevector.draw.html?highlight=draw - Visualizing a Quantum Circuit:
https://qiskit.org/documentation/tutorials/circuits_advanced/03_advanced_circuit_visualization.html - Basic Qiskit Syntax:
https://qiskit.org/textbook/ch-appendix/qiskit.html - Learn in Qiskit:
https://qiskit.org/learn/ - Qiskit:
https://qiskit.org - Qiskit Documentation:
https://qiskit.org/documentation/index.html