- Student Help Center
- Definitions
- ISM Terms
What is a Box Plot?
Box Plot
A box plot is a way of statistically representing the distribution of given data through five main dimensions.
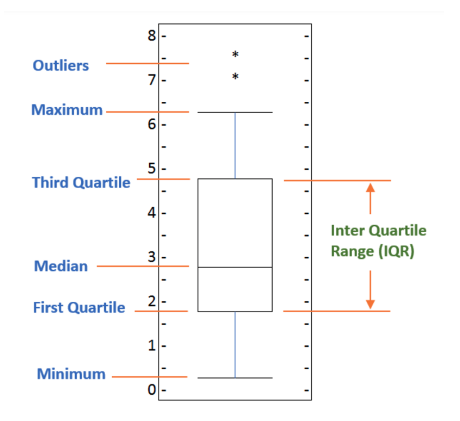
- The first dimension is minimum, which is the smallest number in the sorted data.
- The second dimension is first quartile, which is the point 25% of the way through the sorted data. In other words, a quarter of the datapoints are less than this value.
- The third dimension is median, which is the median of the sorted data.
- The fourth dimension is third quartile, which is the point 75% of the way through the sorted data. In other words, three-quarters of the data points are less than this value.
- The fifth dimension is, which is the highest number in the sorted data.